Language:



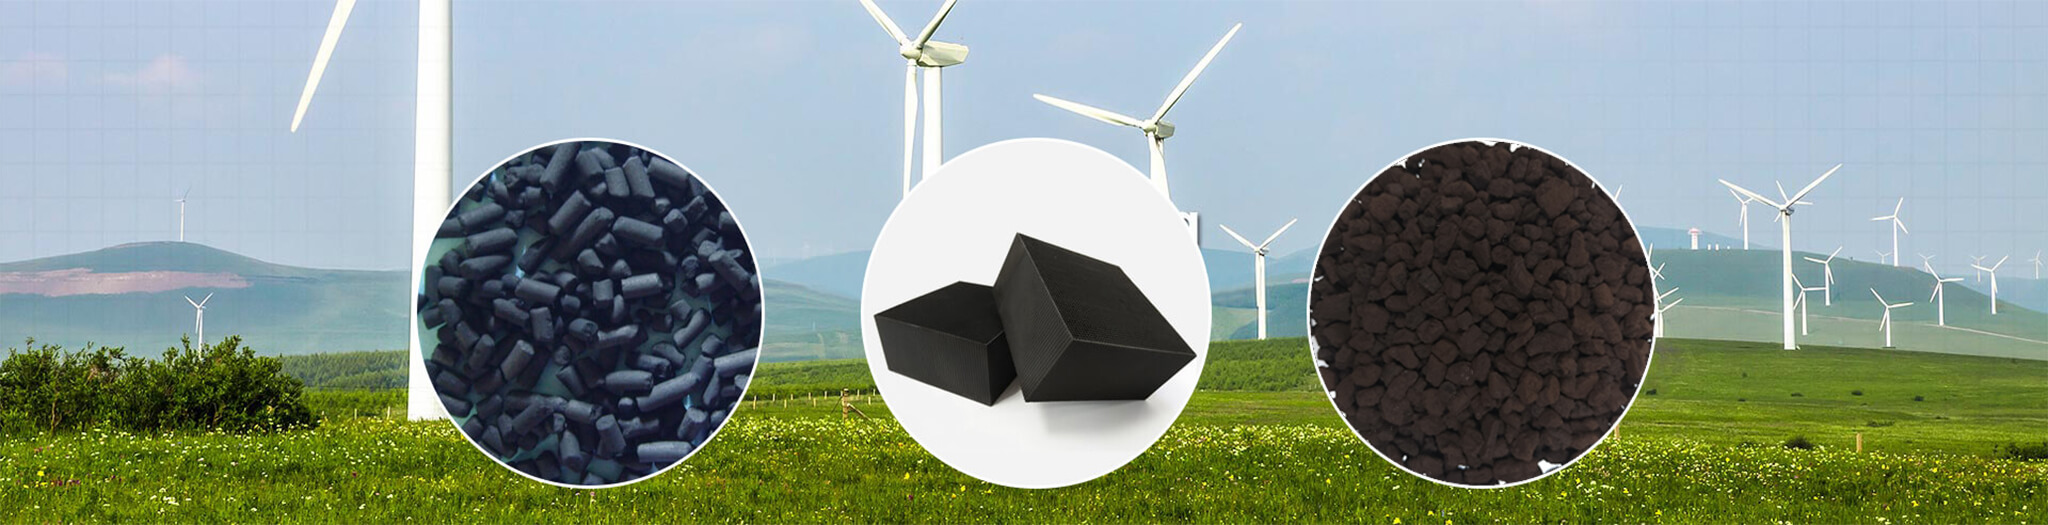
The decomposition efficiency, service life, and operating cost of a catalyst are fundamentally determined by how well it matches the actual operating conditions. Temperature, humidity, impurity composition, and concentration fluctuations—each of these parameters can point to a completely different catalyst solution. Yet in real‑world engineering, a significant number of users make purchasing decisions based solely on a product data sheet claiming “99% decomposition efficiency,” while overlooking the systematic impact of these operating factors on catalyst performance. The result is often a catalyst that performs excellently under standard laboratory conditions but suffers a drastic efficiency drop within months of field deployment—and may even trigger environmental penalties due to ozone leakage. The selection of an ozone decomposition catalyst is, in essence, not about “choosing a product” but about “matching a solution to a specific set of operating conditions.” The depth and accuracy of the operating‑condition analysis directly determine the success or failure of the selection process. To discuss efficiency without reference to operating conditions has no practical engineering meaning.
The starting point for catalyst selection is to establish a fundamental understanding: catalyst performance is a function of operating conditions. The same catalyst can exhibit several‑fold differences in decomposition efficiency and service life under different temperatures, humidities, and impurity profiles—discussing performance without reference to operating conditions holds no engineering value.
In practice, three types of cognitive biases are most common and often directly lead to selection mistakes:
Bias 1: Substituting laboratory data for field requirements. The “99% decomposition efficiency” claimed by suppliers is typically measured under standard conditions (25 °C, RH below 50%, clean air, and a specific space velocity)—while field conditions often involve high humidity, dust, sulfur‑containing or silicon‑containing compounds, which are far from the standard test environment.
Bias 2: Substituting initial efficiency for long‑term efficiency. A catalyst with 99% initial efficiency that drops to 80% after three months is far less valuable than one with 95% initial efficiency that maintains 93% after two years. Focusing only on initial efficiency while ignoring the efficiency decay curve is one of the most costly blind spots in catalyst selection.
Bias 3: Substituting unit‑price advantage for life‑cycle cost. The “lowest price first” purchasing logic is particularly dangerous in catalyst selection—a product that costs half as much but lasts only one‑quarter as long actually has double the annualized cost.
The direct consequences of poor selection include, but are not limited to: rapid efficiency decay failing to meet emission standards, frequent catalyst replacement leading to production shutdown losses, environmental fines, and reputational damage. An electronics factory once selected a low‑cost ozone decomposition catalyst to treat silicon‑containing exhaust gas; within just two months, the efficiency plummeted from 98% to 60%, forcing a shutdown for replacement. The direct economic loss far exceeded several times the purchase cost of the catalyst. A scientific selection must be based on a systematic and accurate diagnosis of the operating conditions.
The effect of temperature on ozone catalytic decomposition is described by the Arrhenius equation—a 10 °C drop typically halves the reaction rate constant. Low temperatures (<10 °C) significantly constrain catalyst activity; for applications such as outdoor installations in northern winters or cold‑storage environments, catalysts optimized for low‑temperature activity must be selected. Literature reports that K⁺‑doped ε‑MnO₂ catalysts maintain excellent ozone decomposition performance at 0 °C.
High temperatures are also a concern. Prolonged operation above 80 °C can cause active components to migrate and agglomerate on the support, or induce phase transformations, leading to irreversible activity loss. In addition, ozone decomposition itself is exothermic (ΔH = –142 kJ/mol); at high ozone concentrations, the bed temperature rise can reach 10–30 °C, so the actual operating temperature must be based on in‑bed measurements.
Humidity is the most critical and most easily underestimated parameter in ozone decomposition catalyst selection. Water molecules (H₂O) are polar and compete with ozone molecules for adsorption at hydrophilic active sites (especially oxygen vacancies) on the catalyst surface. When relative humidity exceeds 60%, the decomposition efficiency of conventional catalysts begins to show measurable decay.
Manganese‑based catalysts are particularly affected by moisture—the higher the relative humidity, the more water molecules adsorb on the surface, the greater the fraction of active sites occupied, and the more severe the deactivation. Studies show that Ti‑doped Mn‑based catalysts maintain nearly 100% ozone degradation conversion at 50% RH, retain about 95% at 70% RH, but drop significantly to about 54% when RH rises to 90%.
For high‑humidity conditions, moisture‑resistant catalysts—through hydrophobic surface modification, rare‑earth element doping, or the construction of hydrophobic porous shells—can effectively suppress competitive adsorption of water molecules at active sites and maintain stable decomposition performance even at 90% RH. In scenarios such as wastewater‑treatment plant off‑gas or dyeing‑plant exhaust, where humidity is often saturated, moisture resistance is a mandatory selection criterion.
Certain chemical components present in the exhaust gas can cause catalyst poisoning, and most poisoning is irreversible—meaning the activity loss cannot be recovered on‑site. Based on the poisoning mechanism, typical poisons can be classified as follows:
Sulfides and chlorides. The poisoning concentration thresholds for sulfur‑containing compounds (H₂S, SO₂, CS₂) and chlorine‑containing gases (Cl₂, HCl) are approximately 5 ppm and 2 ppm, respectively (for continuous exposure exceeding 200 hours). Sulfides can react with active components to form stable metal sulfates, while chlorides may cause active components to volatilize as chlorides.
Siloxanes and heavy‑metal vapors. Siloxanes (concentration >1 ppm) and heavy‑metal vapors (Hg, Pb, As) destroy catalytic function by covering active surfaces or forming alloys with active components—also irreversible deactivation.
Silicon‑containing exhaust is common in spray‑painting workshops, electronic component manufacturing, and precision machining. In addition, dust particles entrained in the gas physically cover the catalyst surface and block pores, shielding active sites until the catalyst completely loses activity. For dust‑laden exhaust, front‑end dust removal or filtration must be installed before the catalytic bed.
The ozone concentration in the gas to be treated can range from low levels (1–50 ppm) to high levels (1%–3%, i.e., 10,000–30,000 ppm)—spanning several orders of magnitude. Different concentration ranges impose different requirements on the selection of active components, active‑component loading, catalytic bed height, and reactor design.
Concentration fluctuations are equally important. In ozone generation methods such as corona discharge or pulsed‑high‑voltage discharge, transient high‑concentration spikes (peak concentrations up to 3–5 times the average) may occur during system startup or mode switching, requiring the catalyst to have good impact resistance. Before selection, complete data on the time‑weighted average, peak, and fluctuation range of the ozone concentration in the exhaust must be obtained.
| Operating Dimension | Key Parameters | Impact on Catalyst Selection | Engineering Recommendations |
|---|---|---|---|
| Temperature | <10°C / 10–40°C / >80°C | Low T requires low‑T activity‑optimized formulation; high T risk of thermal deactivation | Use in‑bed measured temperature; account for exothermic temperature rise |
| Humidity | RH 60% is the performance inflection point | RH >60% requires moisture‑resistant catalyst | Wastewater/printing plant exhaust must mandate moisture resistance |
| Sulfides/Chlorides | H₂S ≥5 ppm / Cl₂ ≥2 ppm (200h exposure) | Require anti‑poisoning formulation or pre‑treatment | Poisoning is irreversible; prevention is primary |
| Siloxanes | Concentration >1 ppm | Must use specialized anti‑siloxane formulation | Special attention for painting and electronics exhaust |
| Ozone Concentration | Low (1–50 ppm) / High (1%–3%) | Higher concentration requires higher active‑component loading | Obtain average, peak, and fluctuation range |
| Particulates | Dust concentration ≥5 mg/Nm³ | Install dust removal/filtration before catalytic bed | Prevent dust from covering active sites |
Table 1: Six key operating parameters and their impact on catalyst selection
The catalyst performance data sheet lists several technical indicators, but the true engineering meaning of each often differs from its literal interpretation. The following provides an engineering‑level explanation of three core parameters.
Initial decomposition efficiency is the instantaneous efficiency measured on a fresh catalyst (i.e., before any aging or long‑term operation). This number has limited engineering reference value—what truly determines the catalyst’s field performance is the efficiency‑versus‑time curve. A high‑quality catalyst should maintain a decomposition efficiency above 95% throughout its design service life (typically 1–3 years, with some premium products reaching 3–5 years).
During selection, the supplier should be required to provide two types of data: (1) accelerated aging test data (efficiency retention measured after accelerated aging under simulated operating conditions); and (2) actual operating case histories and efficiency tracking records under similar operating conditions. A selection decision based solely on a laboratory‑issued initial‑efficiency test report is unreliable for engineering purposes.
Space velocity (h⁻¹) is defined as the volume of gas processed per unit volume of catalyst per unit time. For example, 10,000 h⁻¹ means that 1 m³ of catalyst can process 10,000 m³ of gas in one hour.
There is a well‑defined trade‑off between space velocity and decomposition efficiency—the higher the space velocity, the greater the processing capacity per unit volume, but the shorter the contact time between gas and catalyst surface, reducing the time available for ozone molecules to diffuse to active sites and react, potentially lowering decomposition efficiency. In engineering design, high‑flow applications (such as whole‑workshop exhaust systems) favor higher space velocities (≥15,000 h⁻¹) to reduce reactor volume, equipment investment, and fan energy consumption; while low‑concentration, low‑flow precision applications can use lower space velocities (5,000–10,000 h⁻¹) to ensure decomposition efficiency above 99%.
Pressure drop is the resistance that the catalyst bed imposes on gas flow, and its direct economic consequence is increased fan energy consumption. For example, in a system processing 10,000 Nm³/h, if the catalyst bed pressure drop is 1,000 Pa, the annual fan electricity consumption is about 10,000–15,000 kWh; if the pressure drop is 5,000 Pa, the annual consumption rises to 50,000–75,000 kWh. At an average industrial electricity price of 0.8 RMB/kWh, the annual electricity cost difference between 1,000 Pa and 5,000 Pa is 32,000–48,000 RMB. For a 10‑year design life, this difference can reach 300,000–500,000 RMB—enough to cover the entire catalyst purchase cost.
The magnitude of pressure drop depends on catalyst morphology, bed packing, space velocity, and gas properties. This parameter is often underestimated during the selection phase, yet it serves as the critical bridge linking “performance specifications” to “operating costs.”
There is no absolute superiority between pelletized and honeycomb catalysts—they are two technical forms suited to different operating conditions. The essence of selection is to rationally match the morphology to the operating characteristics.
Pelletized catalysts are typically shaped as spheres, cylinders, or irregular particles with equivalent diameters mostly in the range of 2–8 mm. They are loaded into the reactor in a random, bulk‑packed manner, forming a bed with a void fraction typically between 0.35 and 0.45. The advantages of pelletized forms include: (1) stronger poisoning resistance—if the exhaust contains low concentrations of poisons, engineering measures such as increasing bed height or installing a guard bed can be applied; (2) the packed bed acts as a depth filter, capturing some of the dust entrained in the gas; and (3) loading and replacement operations are straightforward. Their disadvantage is higher pressure drop—under the same space velocity, the pressure drop of a pelletized bed is usually 3–5 times that of a honeycomb bed.
Honeycomb catalysts are produced by extrusion as monolithic blocks with dozens to hundreds of parallel square or circular channels, with the active components coated on the channel walls. Their geometric surface area typically ranges from 300 to 500 m²/m³, and the bed void fraction can reach 0.65–0.75. The outstanding advantages of honeycomb forms are: (1) significantly lower pressure drop compared to pelletized beds, especially suitable for high‑flow applications; and (2) higher geometric surface area per unit reactor volume, improving volumetric processing efficiency. Their drawback is relatively weaker resistance to plugging and fouling—once channel inlets are blocked by dust or active surfaces are covered by contaminants, on‑site recovery is difficult.
| Comparison Item | Pelletized Catalyst | Honeycomb Catalyst | Selection Guidance |
|---|---|---|---|
| Bed Void Fraction | 0.35–0.45 | 0.65–0.75 | Honeycomb offers lower pressure drop and energy savings |
| Geometric Surface Area | Depends on particle size | 300–500 m²/m³ | Honeycomb has higher volumetric processing capacity |
| Pressure Drop (at same SV) | Higher (3–5× honeycomb) | Lower | Honeycomb preferred for high‑flow applications |
| Plugging/Poisoning Resistance | Stronger (bed acts as filter) | Weaker (channel blockage hard to recover) | Pelletized preferred for dust‑laden/poison‑laden exhaust |
| Loading/Replacement Operation | Simple, field‑operable | Requires overall hoisting, space‑intensive | Pelletized offers operational convenience |
| Applicable Scenarios | Dust‑laden, poison‑laden, high concentration, low flow | Clean, high flow, low pressure‑drop requirement | Comprehensive assessment based on operating conditions |
Table 2: Engineering property comparison between pelletized and honeycomb catalysts and selection guidance
The most common pitfall in catalyst purchasing decisions is judging solely by unit price. Establishing a correct economic evaluation framework is a critical defense against selection errors.
Life‑Cycle Cost (LCC) is the correct metric for evaluating catalyst economics. LCC should at least include four cost components: catalyst purchase cost, replacement labor cost, production‑shutdown loss, and operating energy cost (primarily electricity for fans to overcome bed pressure drop).
Comparing only purchase prices can lead to completely misleading conclusions. Consider the following hypothetical calculation: Catalyst A costs 2,000 RMB/L and has a design life of 2 years; Catalyst B costs 1,000 RMB/L and has a design life of 6 months. The annualized purchase cost for A is 1,000 RMB/(L·year), while for B it is 2,000 RMB/(L·year)—the cheaper unit‑price B actually costs twice as much on an annualized basis. If we further include the production‑shutdown and labor costs due to B’s higher replacement frequency, the economic gap becomes even more pronounced.
In addition, two other factors should be included in the evaluation:
Mechanical strength. The catalyst must withstand continuous gas‑flow impact and equipment vibration. Insufficient strength leads to particle breakage and pulverization, causing a sharp increase in bed pressure drop and loss of active components; in severe cases, the entire catalyst charge may be scrapped. The sustained pressure‑drop increase will also significantly raise fan energy consumption, translating into considerable operating costs over long‑term operation.
Active component content. The loading of active components per unit volume is one of the core factors determining catalytic capacity and durability. Within a reasonable range, higher active content gives stronger volumetric catalytic performance and longer service life.
Based on the above analysis, the ozone decomposition catalyst selection process can be systematized into the following five steps:
Step 1: Comprehensively acquire operating data. Measure or collect complete information on exhaust temperature range (including winter minima and summer maxima), relative humidity (including seasonal variations), ozone concentration time‑weighted average and peak values, types and concentrations of coexisting impurities, flow rate, and pressure. The more complete the data, the more reliable the selection decision.
Step 2: Define the constraints for space velocity and bed pressure drop. Based on the gas flow rate, site space limitations, maximum allowable pressure drop, and target decomposition efficiency, determine a reasonable space velocity design value and the total catalyst volume.
Step 3: Lock in the catalyst type based on the key limiting factors. Targeting the core constraints of the operating conditions (high humidity, sulfur‑/silicon‑containing poisons, low temperature, etc.), select a catalyst formulation with the corresponding tolerance properties. Specialty properties such as moisture resistance, anti‑poisoning capability, and low‑temperature activity must be matched one‑to‑one with the operating requirements.
Step 4: Use life‑cycle cost as the yardstick for economic evaluation. Input the unit price, design life, replacement frequency, and pressure‑drop level of each candidate into the LCC model to calculate the annualized total cost, using this as the economic basis for the final decision.
Step 5: Evaluate the supplier’s technical capability and engineering experience. Investigate whether the supplier possesses the specialized technologies relevant to the operating conditions (e.g., moisture‑resistant modification, anti‑poisoning formulations), whether they have successful application cases under similar operating conditions, and whether they can provide necessary technical support and after‑sales service.
During the engineering design phase, three additional engineering details deserve attention: whether a gas‑liquid separator or dehumidification device is needed before the catalytic bed for high‑humidity air; whether sufficient‑precision front‑end filtration is installed for dust‑laden exhaust; and whether the reactor internal flow distribution design ensures uniform gas passage across the bed cross‑section to avoid efficiency loss due to short‑circuiting or stagnant zones.
Ozone decomposition catalyst selection is a systematic technical endeavor spanning chemistry, materials science, chemical reaction engineering, and engineering economics—its complexity far exceeds simply comparing a few product data sheets. Temperature, humidity, impurity composition, space velocity requirements, allowable pressure drop—each change in any operating parameter may point to a completely different catalyst solution. Selection that ignores operating‑condition analysis essentially trades short‑term cost savings for uncertain operating information—the result is often higher long‑term total costs and greater compliance risks. A scientific selection process starts with a systematic diagnosis of the operating conditions, then proceeds sequentially through performance matching, morphology selection, economic evaluation, and supplier assessment, ultimately arriving at the technically feasible and economically rational optimal solution for the specific operating condition. For engineering professionals facing ozone abatement needs, mastering this selection methodology is far more valuable in the long run than memorizing the specifications of any single product.
author:Gloria
date:2026-07-27
Contact: Candyly
Phone: 18142685208
Tel: 0731-84115166
Email: minstrong@minstrongchina.com
Add: E2 Building, Kinglory Science And Technology Industrial Park, Wangcheng Area, Changsha, Hunan, China.